Total Number of Runs, Hits & Errors in Major League Baseball Games
How to Read this Graph
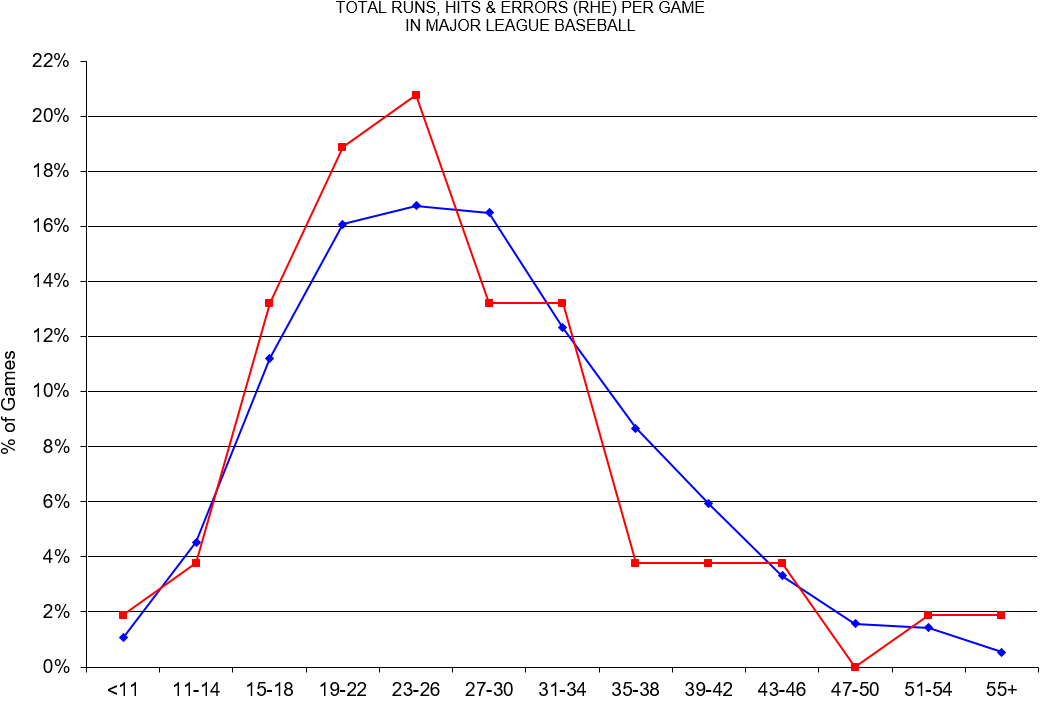
X Axis: The # of Runs, Hits and Errors (RHE) Per Game, in Groups of 4
Y Axis: Percentage of MLB Games
Blue Line: 2,800 regular season MLB games between 2012-2017
Red Line: 53 MLB All-Star Games, 1964-2016
Examples:
Only 1.1% of regular season games have 10 or fewer total runs, hits and errors
The most common RHE distributions are in the 19-22, 23-26 and 27-30 ranges